Chart Reading and Technical Analysis Lab
Read OHLCV charts, distinguish trend from noise, apply indicators cautiously and backtest a rules-based hypothesis without look-ahead bias.
intermediate · 300 minutes · Market Pulse Academy · self-study text
Learning objectives
- Read OHLCV charts, distinguish trend from noise, apply indicators cautiously and backtest a rules-based hypothesis without look-ahead bias.
Curriculum
1. OHLCV Candles, Timeframes and Chart Integrity · Free preview
Open lesson2. Trend, Ranges, Support and Resistance
Open lesson3. Moving Averages, RSI, MACD and False Signals
Open lesson4. Risk Management: Sizing, Slippage and Drawdowns
Open lesson5. Backtesting Without Fooling Yourself
Open lessonFree preview · OHLCV Candles, Timeframes and Chart Integrity
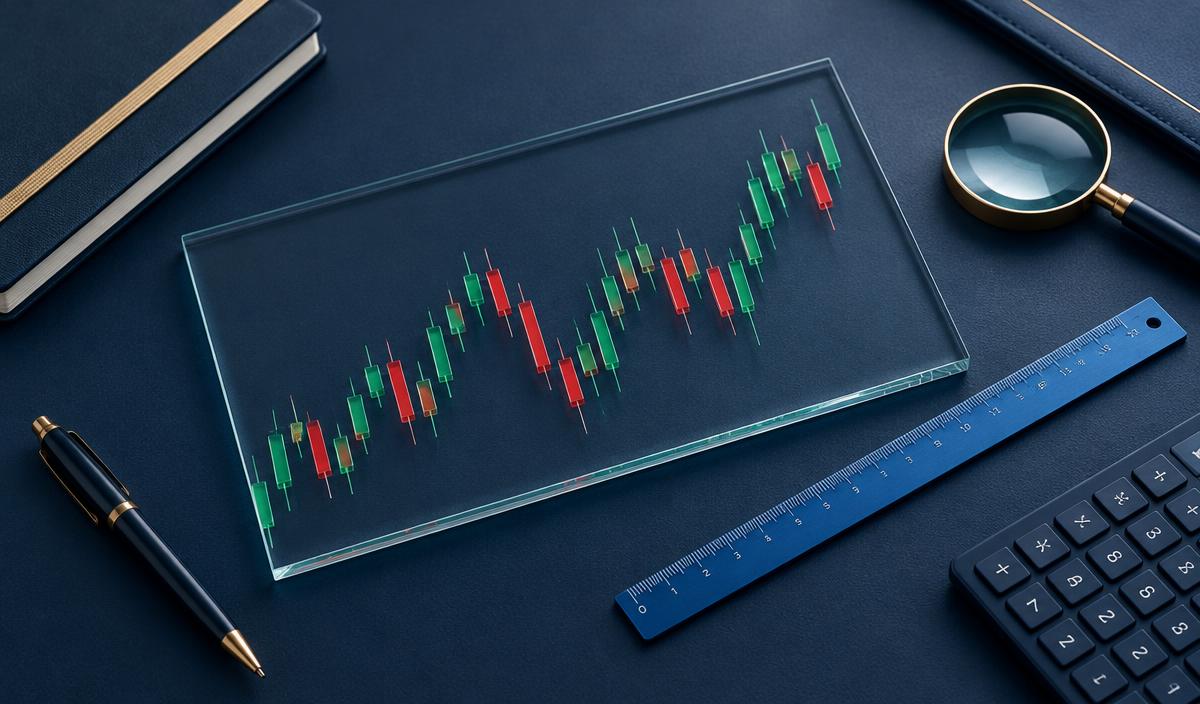
A candlestick summarizes open, high, low and close prices for a chosen time interval; volume records the amount traded according to the data provider. On a daily candle, the high and low are not necessarily prices you could have traded in large size. A green candle typically closes above its open, but charting platforms may use different conventions.
Consider a one-day candle with open $100, high $108, low $97 and close $105. Its body spans $100–$105, and wicks extend to $97 and $108. That candle alone does not reveal the exact sequence of intraday events, and it does not predict tomorrow.
Timeframe matters: A 1-minute trend can occur within a declining daily trend. A weekly chart aggregates information and may help identify larger moves but reacts more slowly. Do not mix an indicator calculated on daily closes with a 5-minute entry without labeling the mismatch.
Data integrity: Corporate actions such as stock splits and dividends may affect adjusted-price charts. Some crypto markets trade continuously while stock exchanges have sessions and gaps. Pre-market data can be thin. Charts sourced from different venues can disagree. Always record symbol, market, timezone, adjustment settings, data source and the date of observation.
Volume caution: An unusually high volume bar can indicate attention, but it does not say who traded, why they traded or who will win next.
Exercise: Given OHLC values (100, 108, 97, 105), label the candle and write three things it does not prove.
Learners familiar with basic stocks and market orders. · Prerequisites: Foundations or equivalent knowledge
Checking account…
Self-study educational material. No guaranteed returns or personalized investment advice. Platform-issued certificates are not accredited.